Enjoy this Wichita Falls Real Estate Market Report for June 2017. You may also search for homes for sale and save your favorite properties. Set up a search and be alerted when new properties matching your criteria come on the market.

Search Wichita Falls Real Estate Market Homes for Sale by Price
| Under $200K | Under $300K |
| Under $400K | Under $500K |
| Over $500K | Most Recent Homes for Sale |
Wichita Falls Real Estate Market Sizzles With Summer Heat
Here is a look at the Wichita Falls Real Estate Market for July 2017. According to a report released on July 14th by the Wichita Falls Association of REALTORS® (WFAR) June 2017 saw 178 single family homes sold in June up from 175 homes sold in June 2016. This is a 2% increase in home sales year over year while the average price increased 5%.
If you’ve been following the market reports, then obviously you are aware that this trend of lower inventory and increasing prices has maintained a steady pace this entire year.
A Look at Housing Stats
The Wichita Falls Association of REALTORS® (WFAR) covers 5 north Texas counties: Archer, Clay, Young, Wichita and Wilbarger. In this area for the month of June 2017:
- 178 Sales Closed — Up from 175 in June 2016
- 207 Homes were In Contract expected to close soon
- 254 New Listings went on the market
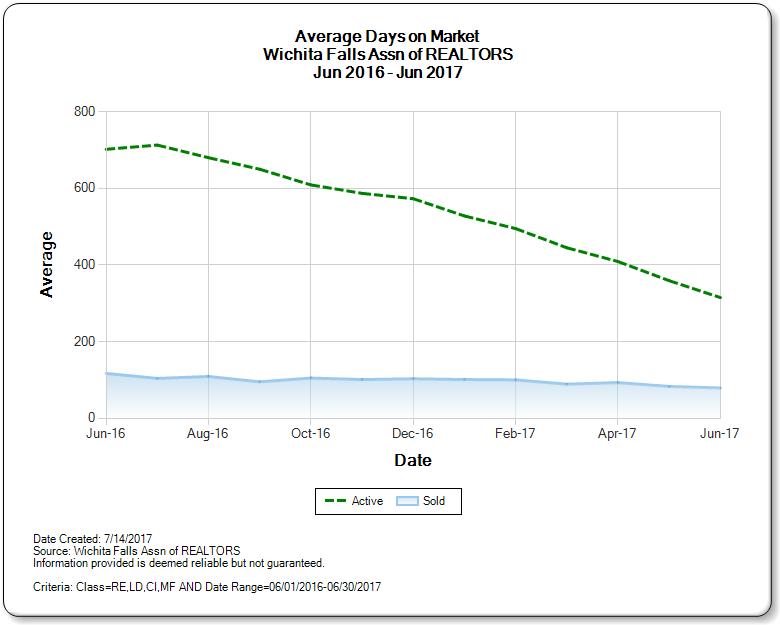
- Average Days on Market (DoM) = 50
- Active Listings = 565
- Month’s of Inventory = 3.2 Months
In the last 2 months there have been 113 Expired Listings.
The trend in median price is increasing with an increase in home sales.
What Does This Data Mean?
When we look at the market trends the month’s of inventory is a key number. This number is the total number of sales in a given month divided into the total number of active listings. In this case 178/565 = 3.2. This means if no other listings were put on the market and the same number of homes continues to sell, it will take 3.2 months to exhaust the current inventory. A neutral market is considered 6 months of inventory. Anything less than 5 is considered a seller’s market and anything greater than 7 is considered a buyer’s market.
Wichita Falls Real Estate Market is Currently in a Seller’s Market
What Does This Data Mean if I am Selling a Home in 2017?
The market is sizzling! Not only are temperatures outside reaching 100 degrees, the housing market has really picked up pace. Just last week we sold one house near Sheppard Air Force Base in a week, then listed another home on the southwest part of town and had an offer in just two days. As you can see from the graph above the number of active listings has steadily declined each month. With the inventory going down and demand going up, the trend suggests prices will continue to increase.
You might also be interested in learning how much are closing costs when selling a house in Texas?
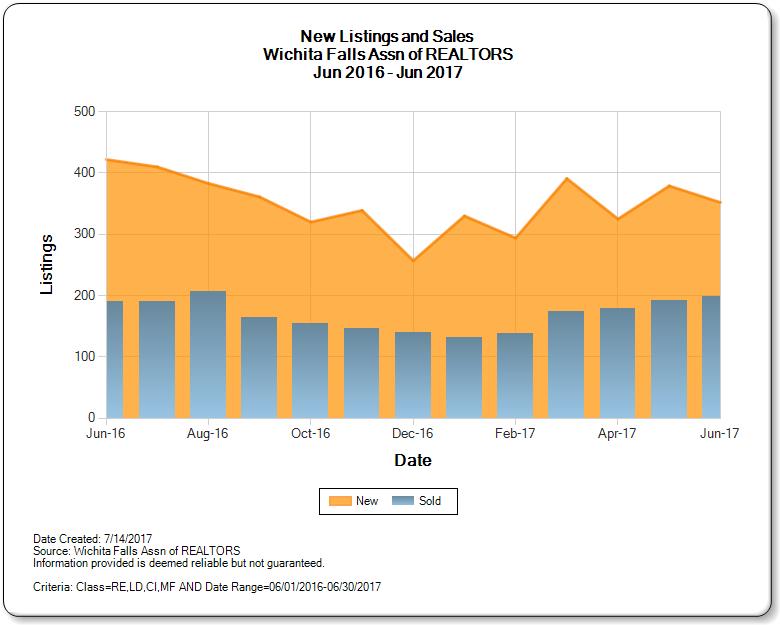
This graph shows the new listings put on the market each month compared to the sales of each month from the beginning of June 2016 to the end of June 2017. As can clearly be seen, the margin between new listings and sold homes is tightening. As a seller, it means that there are fewer homes from which buyers can choose, and the market is providing an opportunity to move quickly and sell at top dollar. The old adage that people buy on emotion is still true. When a buyer walks into your home which is property marketed by an aggressive Wichita Falls real estate agent, is in move-in ready condition and professionally staged, combined with the hot market right now, the buyers emotions will be favorable to making a decision to purchase your home.
There is a shortage of homes on the market right now. The good houses which are move-in-ready, staged well so they evoke positive emotions when buyers enter and are priced well are selling fast and for more

Many homes selling quickly in todays market are updated and staged well. For tips on staging check out our post How to Sell a House Fast in Wichita Falls.
The housing market is changing on a daily basis, and you need a real estate professional who monitors this market and is able to interpret it for you and advise you on how to reach your real estate goals. To find out how recent sales have affected the value of your home, click here to obtain your home value online in only 15 seconds.
What Does This Data Mean if I am Buying a Home in 2017?
A very positive aspect of the Wichita Falls Real Estate Market is that housing prices remain relatively constant. We do not see the huge fluctuations that are seen in other parts of the country such as the coastal communities or Nevada who see large changes. None the less, the trend in Wichita Falls housing prices is up.
You might also be interested in learning how much are closing costs when buying a house in Texas?
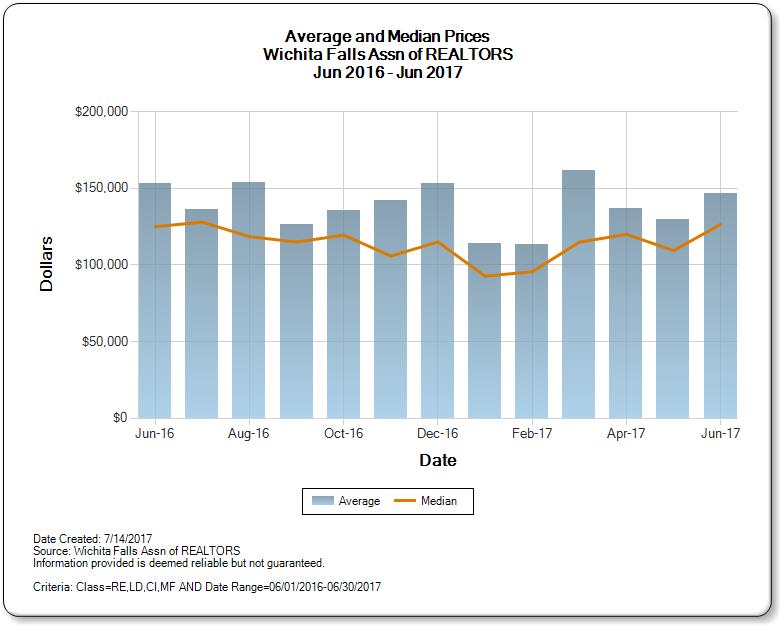
This graph shows the average price in the bars versus the median price depicted by the line. The average price of home which sold in June 2017 if $141,947 up from $135,252. This is relatively close, however slightly above the median price which is the center point between the highest and lowest price home sold. A majority of homes selling in the market are within 20% of the median. For example, 74 homes sold between $100,000 and $200,000 out of the 178 sales last month, and only 3 homes sold over $300,000. Most of the competition is in the middle range, however that doesn’t mean higher priced homes aren’t selling. There are fewer on the market, so the demand is quite high for all price points in today’s real estate market even though the actual numbers are smaller at the top end.
Burkburnett TX Real Estate For Sale by Neighborhood
| Ashton | Baber & McCluskey |
| Carriage Estates | Hilltop |
| Henderson | Jan Lee Acres |
| Jan Lee Heights | Mimosa Heights |
| Ranch Estates |
Recently published, Wichita Falls has been named in the Top 10 cities in the country for early retirement. Forbes compared cities all over the nation looking at cost of living, crime rates, and more to determine the best cities, and Wichita Falls was named #3.
For more information on the process to buy a home in Wichita Falls check out The 6 Steps to Buying Home.
Check out the Most Recent Homes for Sale in the Wichita Falls Real Estate Market
See Other 2017 Wichita Falls Market Reports
| February 2017 | March 2017 |
| April 2017 | May 2017 |
| June 2017 | July 2017 |
| August 2017 | |
- Wichita Falls Market Report – June 2018 - July 25, 2018
- Wichita Falls Real Estate Market Report – May 2018 - June 28, 2018
- Wichita Falls Real Estate Market Report Archive - June 5, 2018
- Wichita Falls Real Estate Market Report – April 2018 - May 24, 2018
- Tarrant County Real Estate Market Report – April 2018 - May 24, 2018
- Arlington TX Real Estate Market Report – April 2018 - May 24, 2018
- Tarrant County Real Estate Market Report – March 2018 - April 19, 2018
- Dallas County Real Estate Market Report – March 2018 - April 19, 2018
- Wichita Falls Real Estate Market Report – March 2018 - April 18, 2018
- Arlington TX Real Estate Market Report – March 2018 - April 18, 2018