Wichita Falls Real Estate Market Report – April 2017
Enjoy this Wichita Falls Real Estate Market Report for April 2017. You may also search for homes for sale and save your favorite properties. Set up a search and be alerted when new properties matching your criteria come on the market.
Search Wichita Falls Area Homes for Sale by Price
| Under $200K | Under $300K |
| Under $400K | Under $500K |
| Over $500K | Most Recent Homes for Sale |
Wichita Falls Housing Market Experiences Strong 1st Quarter!
Here is a look at the Wichita Falls Real Estate Market for March 2017. According to a report released on April 14th by the Wichita Falls Association of REALTORS® (WFAR) we had 128 single family homes sold in March down from 154 homes sold in March 2016. The first quarter of 2017 had 362 homes sold versus 349 in the first quarter of 2016. This is a 4% increase in home sales year over year while the average price increased 4%.
A Look at Housing Stats
The Wichita Falls Association of REALTORS® (WFAR) covers 5 north Texas counties: Archer, Clay, Young, Wichita and Wilbarger. In this area for the month of March 2017:
- 128 Sales Closed — Down from 154 in March 2016
- 226 Homes were In Contract expected to close soon
- 235 New Listings went on the market
- Average Days on Market (DoM) = 64
- Active Listings = 548
- Month’s of Inventory = 4.3 Months
The trend in median price is increasing with an increase in home sales. Interest rates are still at historic lows and have only seen a slight increase leading to increased housing affordability.
What Does This Data Mean?
When we look at the market trends the month’s of inventory is a key number. This number is the total number of sales in a given month divided into the total number of active listings. In this case 128/548 = 4.3. This means if no other listings were put on the market and the same number of homes continues to sell, it will take 4.3 months to exhaust the current inventory. A neutral market is considered 6 months of inventory. Anything less than 5 is considered a seller’s market and anything greater than 7 is considered a buyer’s market.
Wichita Falls is Currently in a Seller’s Market
What Does This Data Mean if I am Selling a Home in 2017?
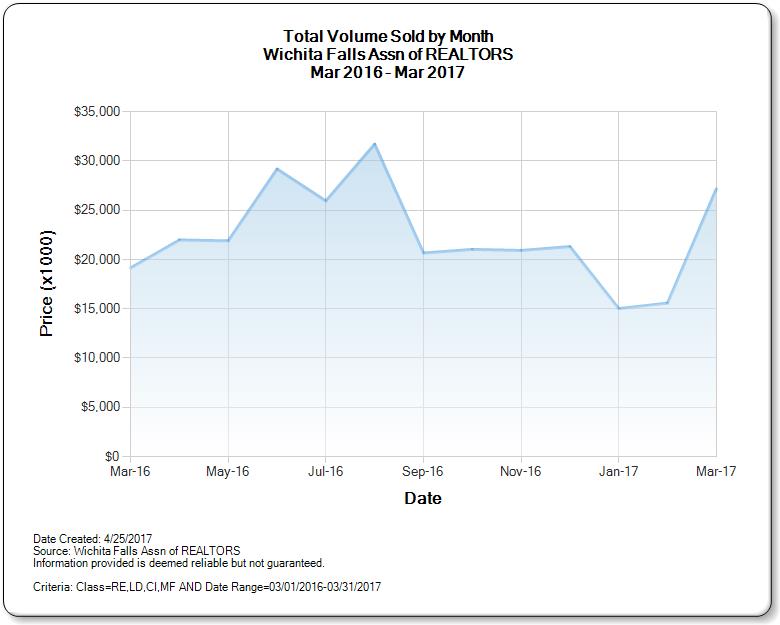
If you or someone you know is looking to sell a home in 2017, this may be the best time to enter the market. Why is that? As you can see from this graph of the Total Volume Sold by Month March 2016 to March 2017, the total volume of sales is significantly higher than one year ago as we approach the peak selling season of May through August. With an average of 60 days on market, and approximately 30-45 days to close once an offer is accepted, backing this timeline puts sellers who want to close and move this summer in a position to list right now. However, it takes more than simply putting a sign in a yard and uploading some pictures to the Internet to sell a home in today’s market. Buyer’s today are savvy, they do a lot of research, and attracting the right buyer to your home who is willing and qualified to buy is both a skill and an art. It is important to choose a REALTOR with a proven track record and aggressive marketing plan.
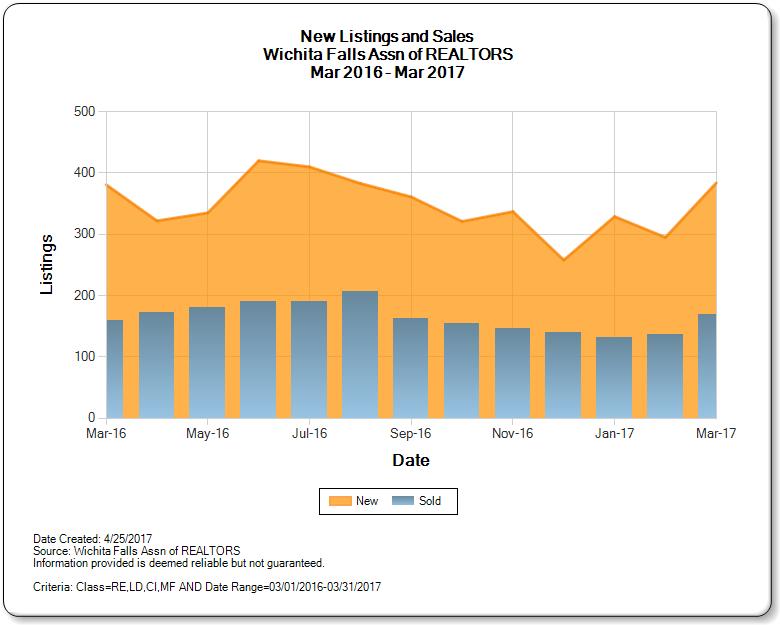
Considering the trend of new housing listings in Wichita Falls versus homes sold by month, you can clearly see the trend of listings increases significantly in the summer months. However, it is obvious since we know the average time on market is over 60 days that these people who enter the market in the peak month are significantly behind the power curve. Therefore, in order to sell in the peak selling months of May through August, sellers must enter the market in April and May. Therefore, now is the best time to list your home for sale.
Many homes selling quickly in todays market are updated and staged well. For tips on staging check out our post How to Sell a House Fast in Wichita Falls.
The housing market is changing on a daily basis, and you need a real estate professional who monitors this market and is able to interpret it for you and advise you on how to reach your real estate goals. To find out how recent sales have affected the value of your home, click here to obtain your home value online in only 15 seconds.
What Does This Data Mean if I am Buying a Home in 2017?
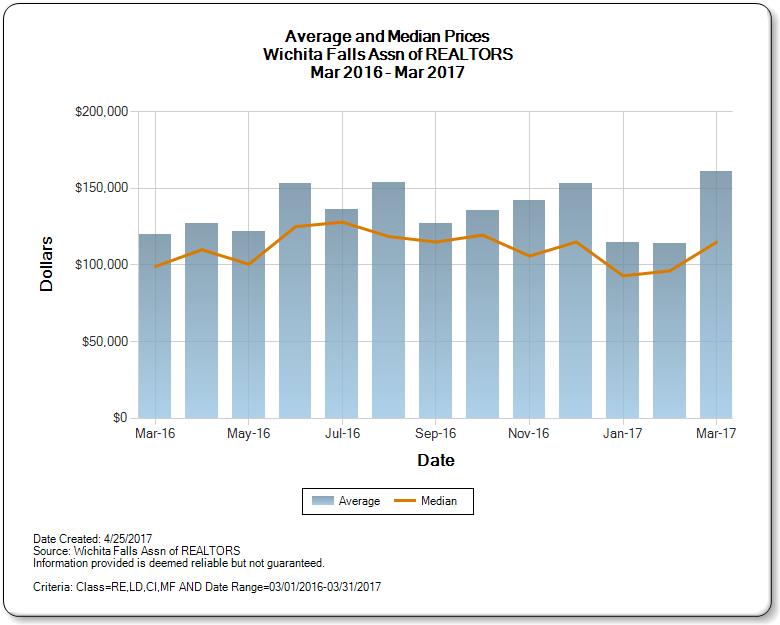
Housing affordability as measured as the percentage of the median household income required to buy a home remains extremely favorable in today’s Wichita Falls and surrounding areas housing market. Interest rates have ticked up a bit, yet remain close to 4%. As you can see in the graph Average and Median Prices the trend is clearly up. Given the market statistics above indicating both sales and prices of Wichita Falls homes for sale have increased while the number of new homes listed for sale has decreased, the conditions are set for this trend line to continue up. Right now, you can lock in historically low interest rates and favorable prices. Therefore, if you are looking to move into your new home any time in 2017, now might be the best time to begin your search.
For more information on the process to buy a home in Wichita Falls check out The 6 Steps to Buying Home.
Check out the Most Recent Homes for Sale in Wichita Falls
See Other 2017 Wichita Falls Market Reports
| February 2017 | March 2017 |
| April 2017 | May 2017 |
| June 2017 | July 2017 |
| August 2017 | |
- Wichita Falls Market Report – June 2018 - July 25, 2018
- Wichita Falls Real Estate Market Report – May 2018 - June 28, 2018
- Wichita Falls Real Estate Market Report Archive - June 5, 2018
- Wichita Falls Real Estate Market Report – April 2018 - May 24, 2018
- Tarrant County Real Estate Market Report – April 2018 - May 24, 2018
- Arlington TX Real Estate Market Report – April 2018 - May 24, 2018
- Tarrant County Real Estate Market Report – March 2018 - April 19, 2018
- Dallas County Real Estate Market Report – March 2018 - April 19, 2018
- Wichita Falls Real Estate Market Report – March 2018 - April 18, 2018
- Arlington TX Real Estate Market Report – March 2018 - April 18, 2018