Arlington TX Real Estate Market Report – February 2018
Enjoy this Arlington TX Real Estate Market Report for February 2018. You may also search for homes for sale and save your favorite properties. Set up a search and be alerted when new properties matching your criteria come on the market.
Search Arlington TX Homes for Sale by Zip Code
| 76005 | 76006 |
| 76012 | 76013 |
| 76016 |
Arlington TX Housing Market Remains Strong through 2017
Here is a look at the Arlington TX Real Estate Market for February 2018. Compared to the same time last year, January experienced a 12.9% decrease in closed sales with an 11.5% decrease in new listings and average days on market of homes for sale in Arlington TX remaining around one month on market.
A Look at Housing Stats
Arlington TX real estate statistics are tracked in the North Texas Real Estate Information System (NTREIS), more commonly known as the Multiple Listing Service or MLS. This is a look at all residential property types including single-family homes, condominiums, and townhouses, including both resale and new construction. In Arlington last month:
- 237 Sales Closed — Down 12.9% from 272 in January 2017
- 268 Homes were In Contract expected to close soon
- 315 New Listings went on the market, Down 11.5% from 356 in January 2017
- Average Days on Market (DoM) = 29 Days Up 11.5% from 26 days in January 2017
- Active Listings = 305 — Down 20.4% from 383 in January 2017
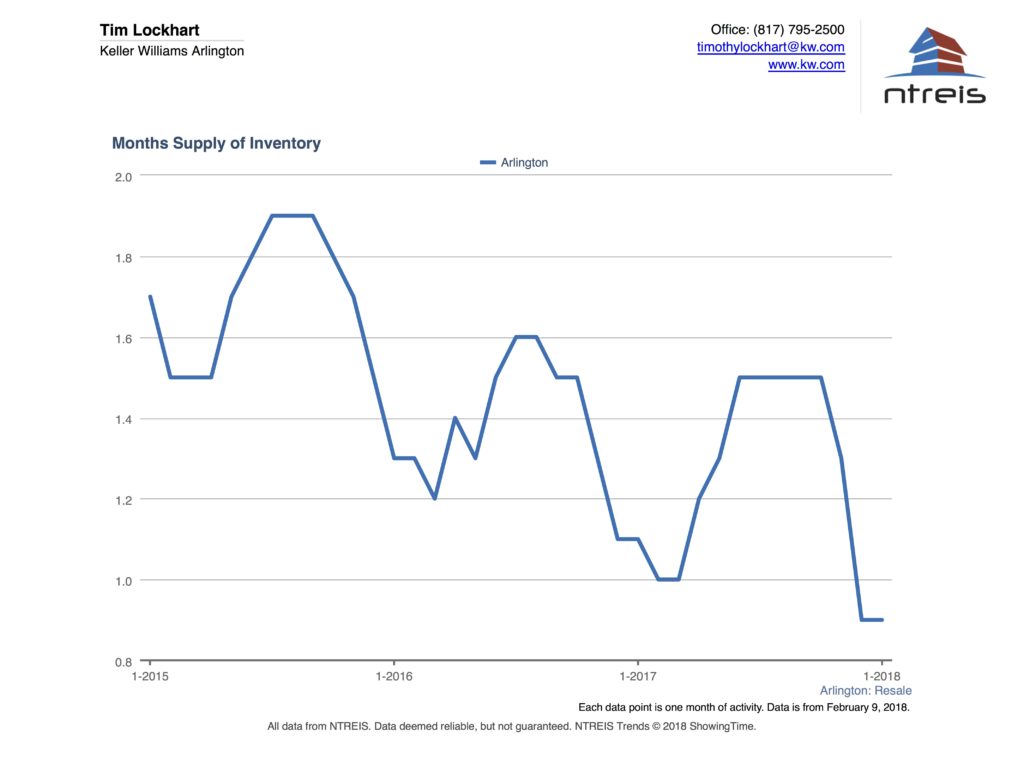
- Month’s of Inventory = 0.9 Months, Down 18.2% change from 1.1 in January 2017
In the last 3 months there have been 91 listings expire without being sold.
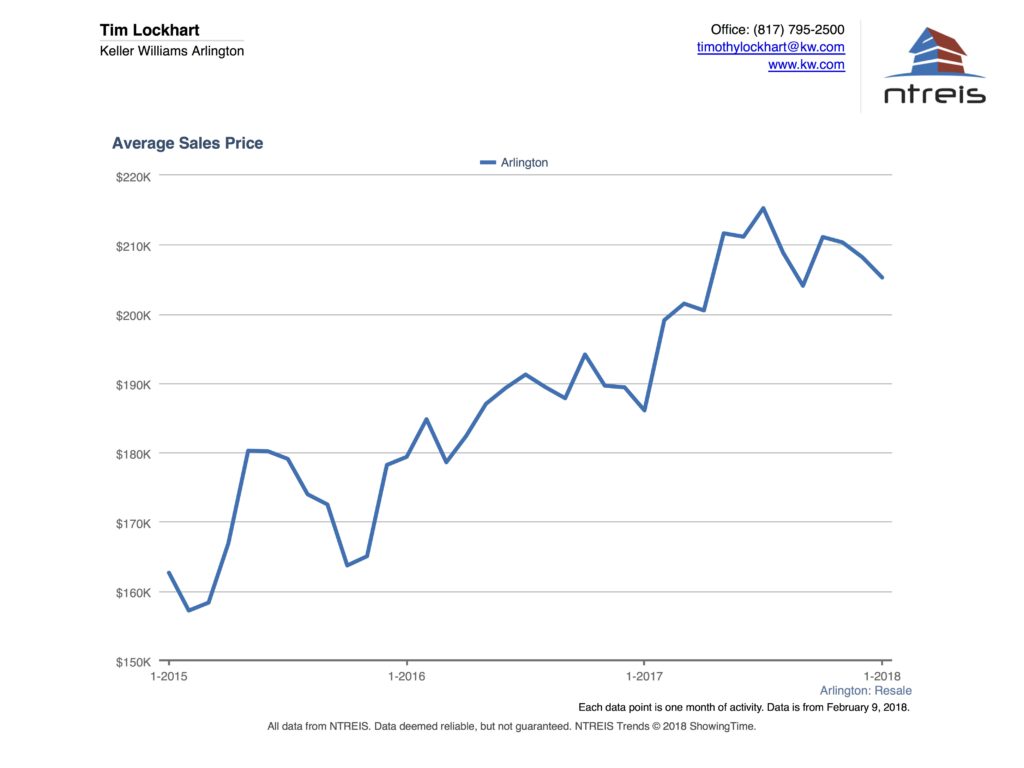
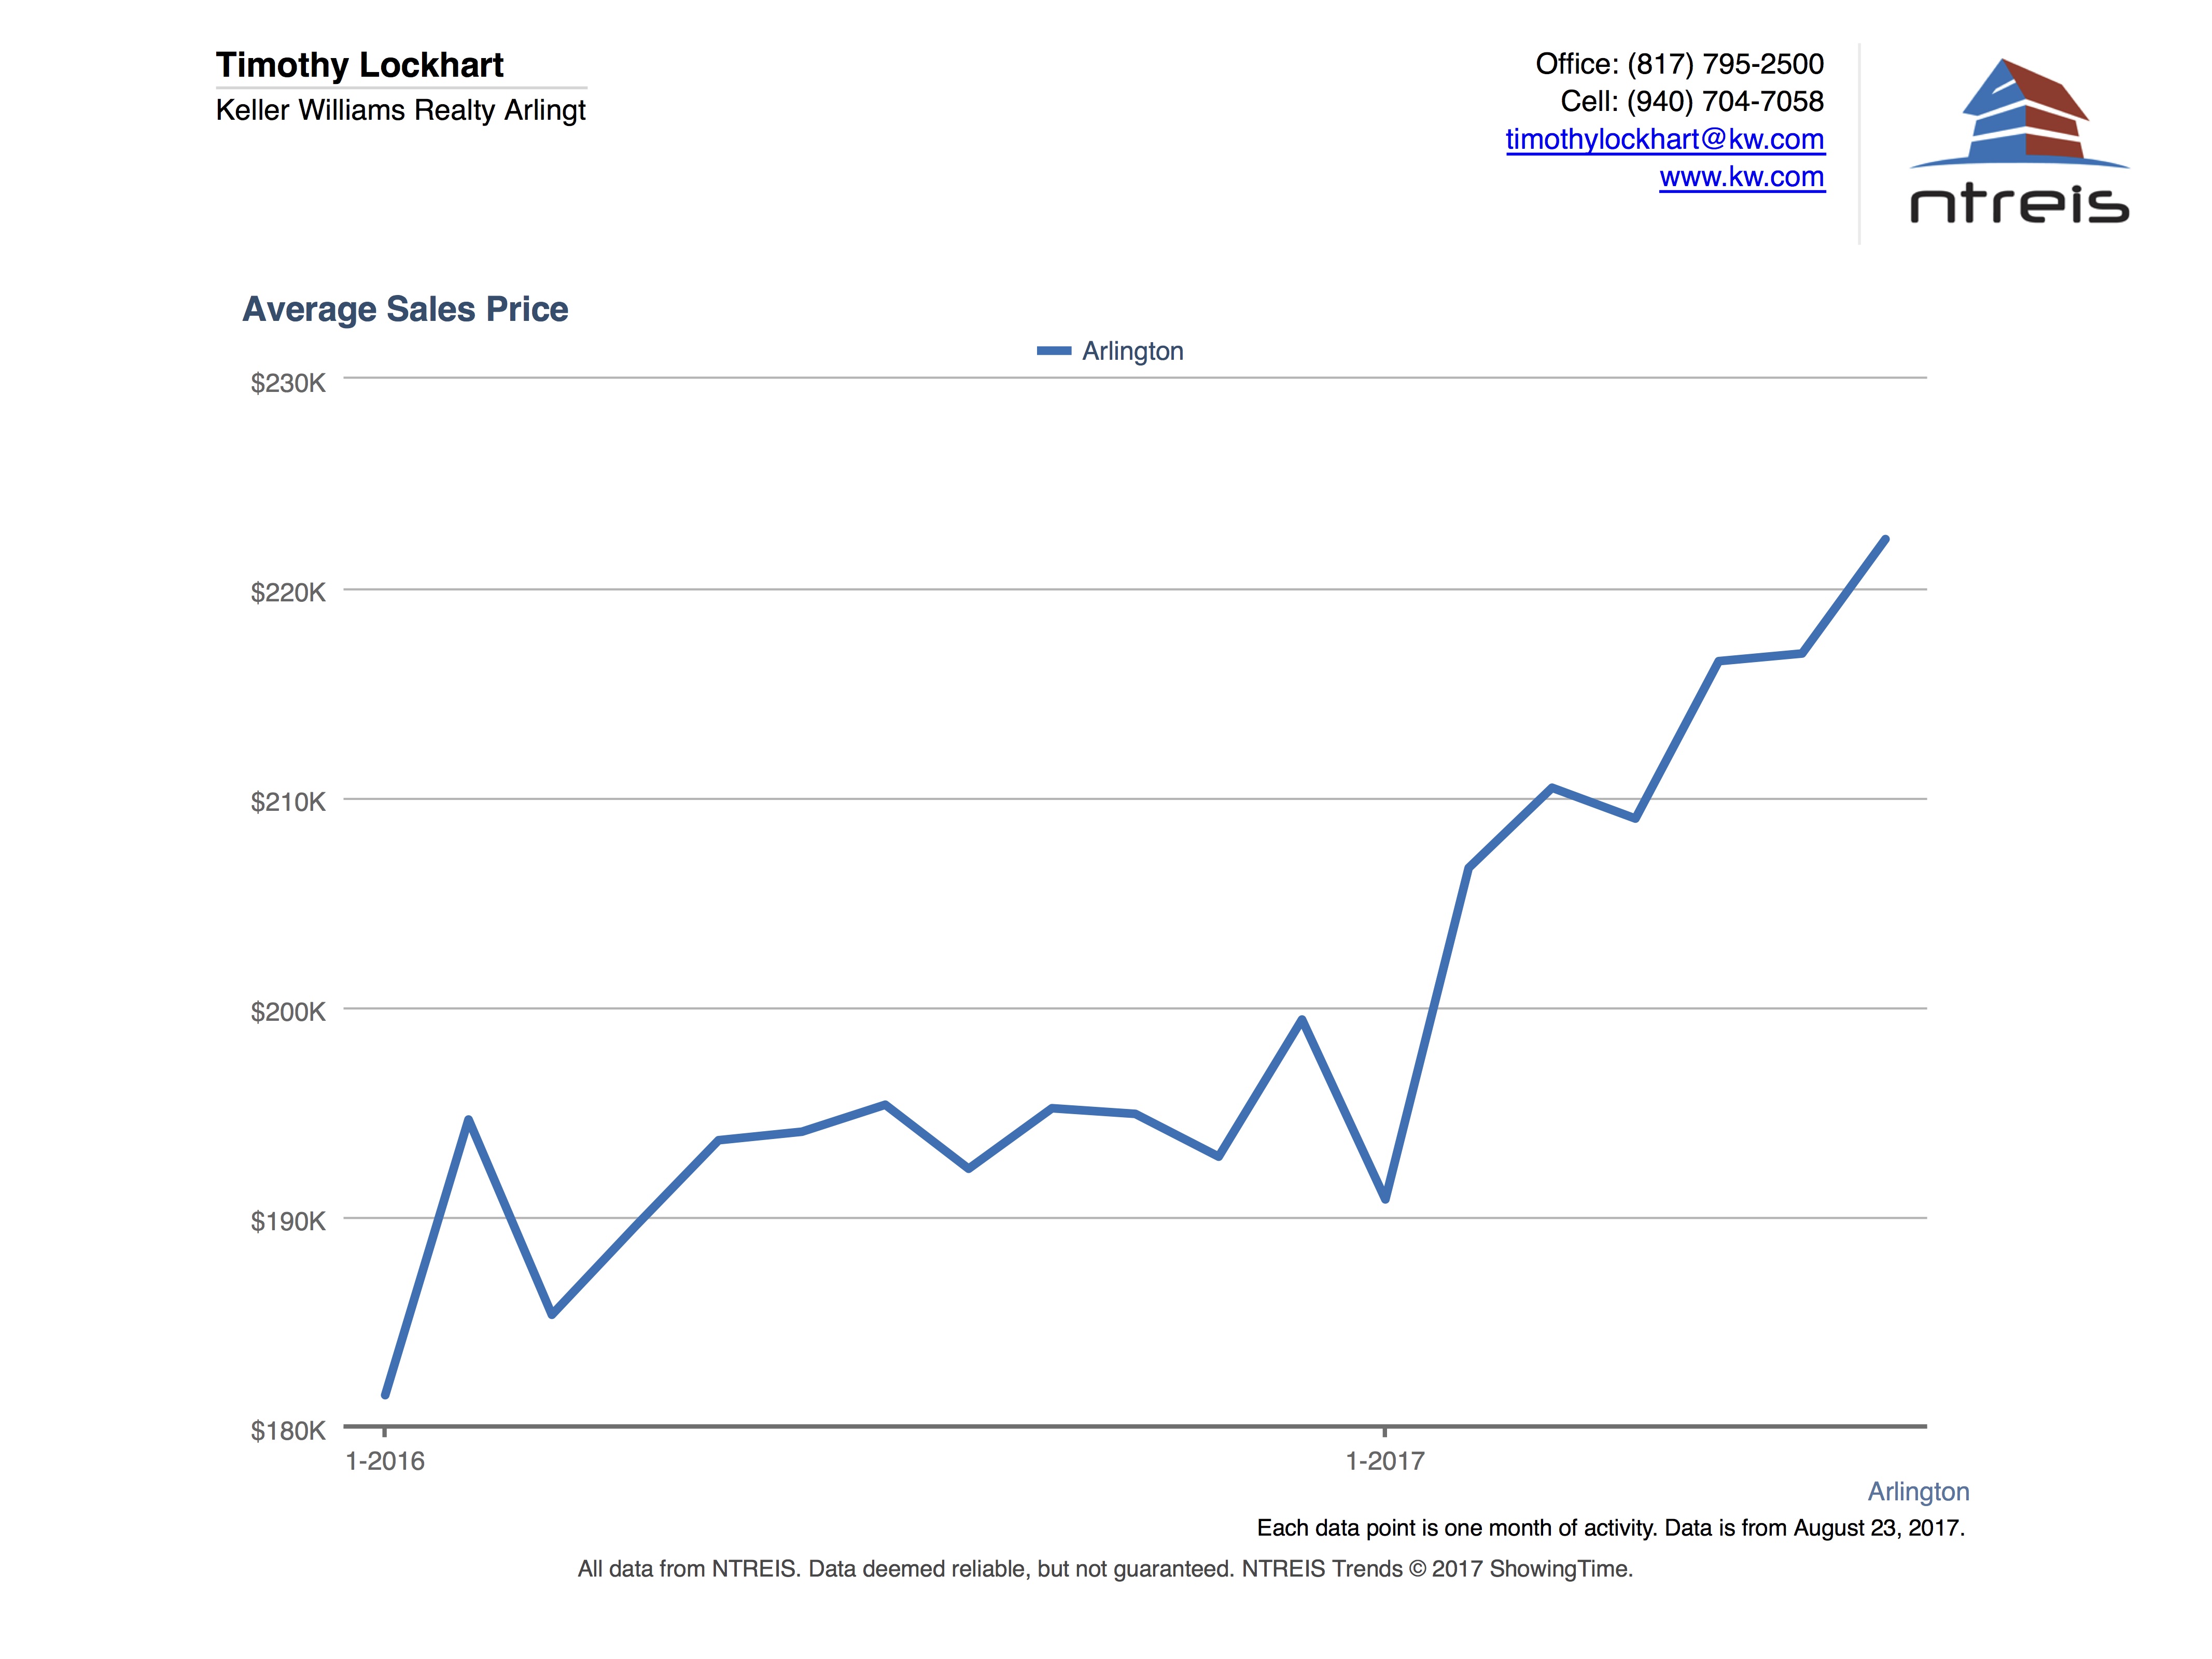
The trend in original list price has increased 13.8% from $200,455 in January 2017 to $228,089 in January 2018 with average list price to sales price ratio at 97.8% indicating that even though there has been a monthly decrease in home sales, the market trend continues upward throughout this year is resulting in higher prices.
Search Arlington TX Real Estate by Price
| Under $200K | Under $300K |
| Under $400K | Under $500K |
| Under $600K | Under $700K |
| Luxury Homes | Most Recent Listings |
What Does This Data Mean?
When we look at the market trends the month’s of inventory is a key number. This number is the total number of home sales in a given month divided into the total number of active listings. This means if no other listings were put on the market and the same number of homes continues to sell, it will take only 1.1 months to exhaust the current inventory. A neutral market is considered 6 months of inventory. Anything less than 5 is considered a seller’s market and anything greater than 7 is considered a buyer’s market.
Arlington is Currently in a strong Seller’s Market
What Does This Data Mean if I am Selling a Home in 2018?
Now might be a really great time to sell a home. After coming off 4 years of record sales and prices, we are due to see a slowing of the rapid growth, however we just haven’t seen a significant slowing yet. It is now February and the holidays are over and the first of the year tends to be a really great time to sell homes for numerous reasons. What about the common wisdom that the best time to sell is the spring and summer? First of all, it is certainly true that a larger quantity of homes sell during the spring and summer. However, since everyone knows that, your competition is waiting for later in the year to list their home. There are certainly buyers out in today’s market as indicated by the extremely low inventory, and these buyers who need to find a home now are not going to wait for homes to be listed in the spring. Therefore, they are choosing from much lower inventory meaning you have less competition. And, what happens when there is demand and low supply? What happens to prices when that toy every kid must have for Christmas starts running low on the store shelves? The law of supply and demand states that when supply is limited and demand is high, then prices go up.
There will be fewer showings during the cold days of winter, which is good for the fact that you will be inconvenienced less, and the buyers who are in the market now are much more serious. So, there are fewer, higher quality showings during this time of year. Furthermore, it will warm up quicker than you think.

Are we beginning to see a shift in the market? We truly won’t know that answer until a few months after it happens when we can look back and say, ah yes, there was the top. We’ve had a few points recently where there was a down turn in prices, only to see activity pick right back up. There are some signs indicating a shifting market, however no one can really know where the exact top of the market is until we look back. We are up month-to-month from a year ago. Interest rates are increasing, however not to the point where they affect affordability at this point. This could be similar to the downward trend which occurred at the beginning of this year which was short lived only to see the upward trend continue. The new tax law passed in December 2017 will not affect the average home owner in Texas since we do not have a state income tax the full $10,000 deduction can be applied to the property taxes.
If your realtor is not tracking the market daily, then you might miss the opportunity to obtain top dollar for your home. Now might actually be the best time to sell a home in Arlington TX. Since there are fewer listings in the fall, the actual percentage of homes selling in the 3rd and 4th quarters actually remains fairly constant. Another factor is, many people were recently displaced from Hurricane Harvey and are buying homes in DFW. If you’re considering selling your home in today’s market, contrary to popular belief it takes a lot more than simply placing a sign in the yard and waiting for the phone to ring.
At the Lockhart Real Estate Team, we offer free consultations where we will review what the most recent homes have sold for that are most closely comparable to yours as well as look at the exiting active inventory buyers will see and compare to yours. With this information in hand, we can develop a tailored marketing approach which starts with strategically pricing your home so it screams value to the buyers in today’s market.
Learn more about Closing Costs when Selling a Home in Arlington TX.
The housing market is changing on a daily basis, and you need a real estate professional who monitors this market and is able to interpret it for you and advise you on how to reach your real estate goals. To find out how recent sales have affected the value of your home, click here to obtain your home value online in only 15 seconds.
What Does This Data Mean if I am Buying a Home in 2018?
Buyers in Arlington are facing a challenge of low inventory. With only an average of 29 days on market and only 0.9 months of inventory, the best homes are going quickly posing a challenge for buyers to find that great home. The good news for buyers is with today’s interest rates remaining so low, home affordability remains very favorable. Arlington TX home prices are lower than many other DFW cities. If you have been renting, it might surprise you to know that many people can actually buy a similar home with lower monthly payments than their current rent. There are also significant tax advantages to buying a home versus renting.
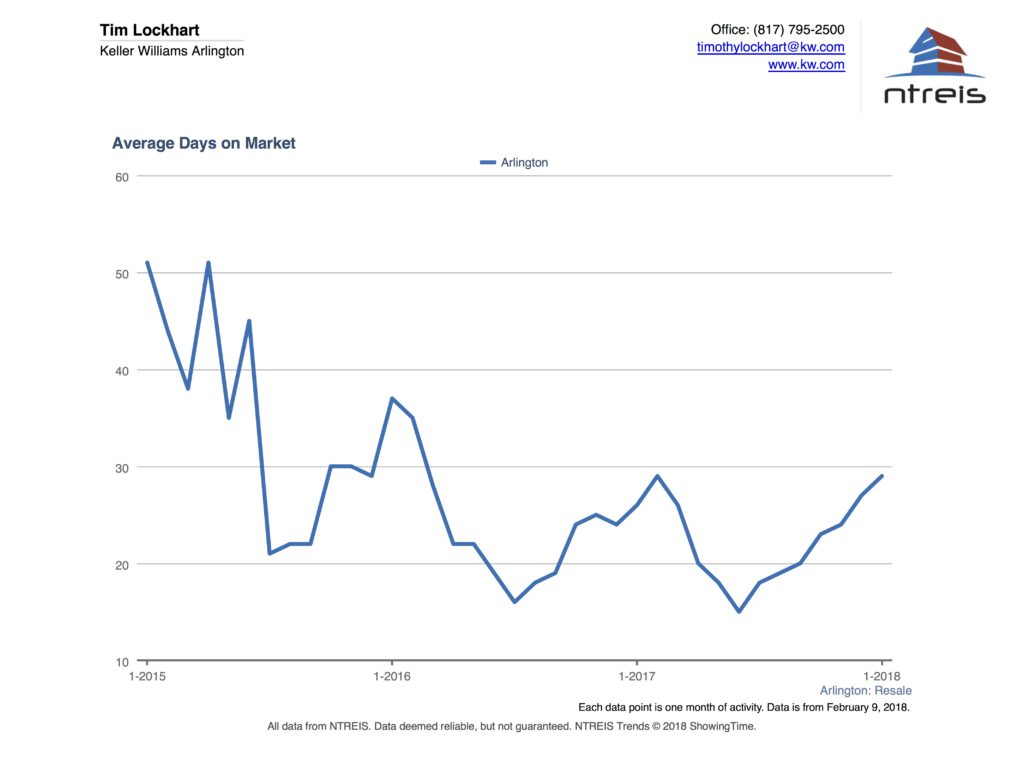
This graph shows the average days on market for houses in the Arlington TX real estate market. Over the last year average days on market has remained historically low. A balanced market is considered to have 6 months of inventory. Many buyers are still missing out even with offers above list price.
If a home you like is on the market and in move-in-ready condition then it is important to move quickly. We offer a free buyer’s consultation where we can walk you through the entire home buying process from beginning to end so you feel comfortable and confident moving forward. It is also important to speak with a lender about becoming pre-qualified so that 1) we are sure which price range to look and 2) we are able to move quickly when we find you that perfect home.
Learn more about Closing Costs when Buying a Home in Arlington TX
Check out the Most Recent Homes for Sale in Arlington TX
Read Archived Arlington TX Real Estate Market Reports | Compare this month to previous months
Arlington TX Real Estate Market Report – April 2018
Arlington TX Real Estate Market Report – April 2018 Enjoy this Arlington TX Real Estate Market Report for April 2018. You may also search for homes for sale and save your favorite properties. Set up a search and be alerted when new properties matching your criteria come on the market. Search Arlington TX Homes for […]
Arlington TX Real Estate Market Report – March 2018
Arlington TX Real Estate Market Report – March 2018 Enjoy this Arlington TX Real Estate Market Report for March 2018. You may also search for homes for sale and save your favorite properties. Set up a search and be alerted when new properties matching your criteria come on the market. Search Arlington TX Homes for […]
Arlington TX Real Estate Market Report – February 2018
Arlington TX Real Estate Market Report – February 2018 Enjoy this Arlington TX Real Estate Market Report for February 2018. You may also search for homes for sale and save your favorite properties. Set up a search and be alerted when new properties matching your criteria come on the market. Search Arlington TX Homes for […]
Arlington TX Real Estate Market Report – January 2018
Arlington TX Real Estate Market Report Enjoy this Arlington TX Real Estate Market Report for January 2018. You may also search for homes for sale and save your favorite properties. Set up a search and be alerted when new properties matching your criteria come on the market. Search Arlington TX Homes for Sale by Zip […]
Arlington TX Real Estate Market Report – December 2017
Arlington TX Real Estate Market Report Enjoy this Arlington TX Real Estate Market Report for December 2017. You may also search for homes for sale and save your favorite properties. Set up a search and be alerted when new properties matching your criteria come on the market. Search Arlington TX Homes for Sale by Zip […]
Arlington TX Real Estate Market Report – November 2017
Arlington TX Real Estate Market Report – November 2017 Enjoy this Arlington TX Real Estate Market Report for November 2017. You may also search for homes for sale and save your favorite properties. Set up a search and be alerted when new properties matching your criteria come on the market. Search Arlington TX Homes for […]
Arlington TX Real Estate Market Report – October 2017
Arlington TX Real Estate Market Report – October 2017 Enjoy this Arlington TX Real Estate Market Report for October 2017. You may also search for homes for sale and save your favorite properties. Set up a search and be alerted when new properties matching your criteria come on the market. Search Arlington TX Homes for […]
Arlington TX Real Estate Market Report – September 2017
Arlington TX Real Estate Market Report – September 2017 Enjoy this Arlington TX Real Estate Market Report for September 2017. You may also search for homes for sale and save your favorite properties. Set up a search and be alerted when new properties matching your criteria come on the market. Search Arlington TX Homes for […]
Arlington TX Real Estate Market Report – August 2017
Arlington TX Real Estate Market Report – August 2017 Enjoy this Arlington TX Real Estate Market Report for August 2017. You may also search for homes for sale and save your favorite properties. Set up a search and be alerted when new properties matching your criteria come on the market. Search Arlington TX Homes for […]
- Wichita Falls Market Report – June 2018 - July 25, 2018
- Wichita Falls Real Estate Market Report – May 2018 - June 28, 2018
- Wichita Falls Real Estate Market Report Archive - June 5, 2018
- Wichita Falls Real Estate Market Report – April 2018 - May 24, 2018
- Tarrant County Real Estate Market Report – April 2018 - May 24, 2018
- Arlington TX Real Estate Market Report – April 2018 - May 24, 2018
- Tarrant County Real Estate Market Report – March 2018 - April 19, 2018
- Dallas County Real Estate Market Report – March 2018 - April 19, 2018
- Wichita Falls Real Estate Market Report – March 2018 - April 18, 2018
- Arlington TX Real Estate Market Report – March 2018 - April 18, 2018